KPMG Valuation Data Source

References:


Available parameters

  • WACC / Cost of Equity / Cost of Debt
  • Risk-free rate
  • Peer group-specific and 70 (sub)sector-specific beta factors (Five-, Two- and One-year-beta factors)
  • Credit spread
  • Market risk premium
  • Country risk premium
  • Inflation delta
  • Average tax rate
  • Selected exchange rates

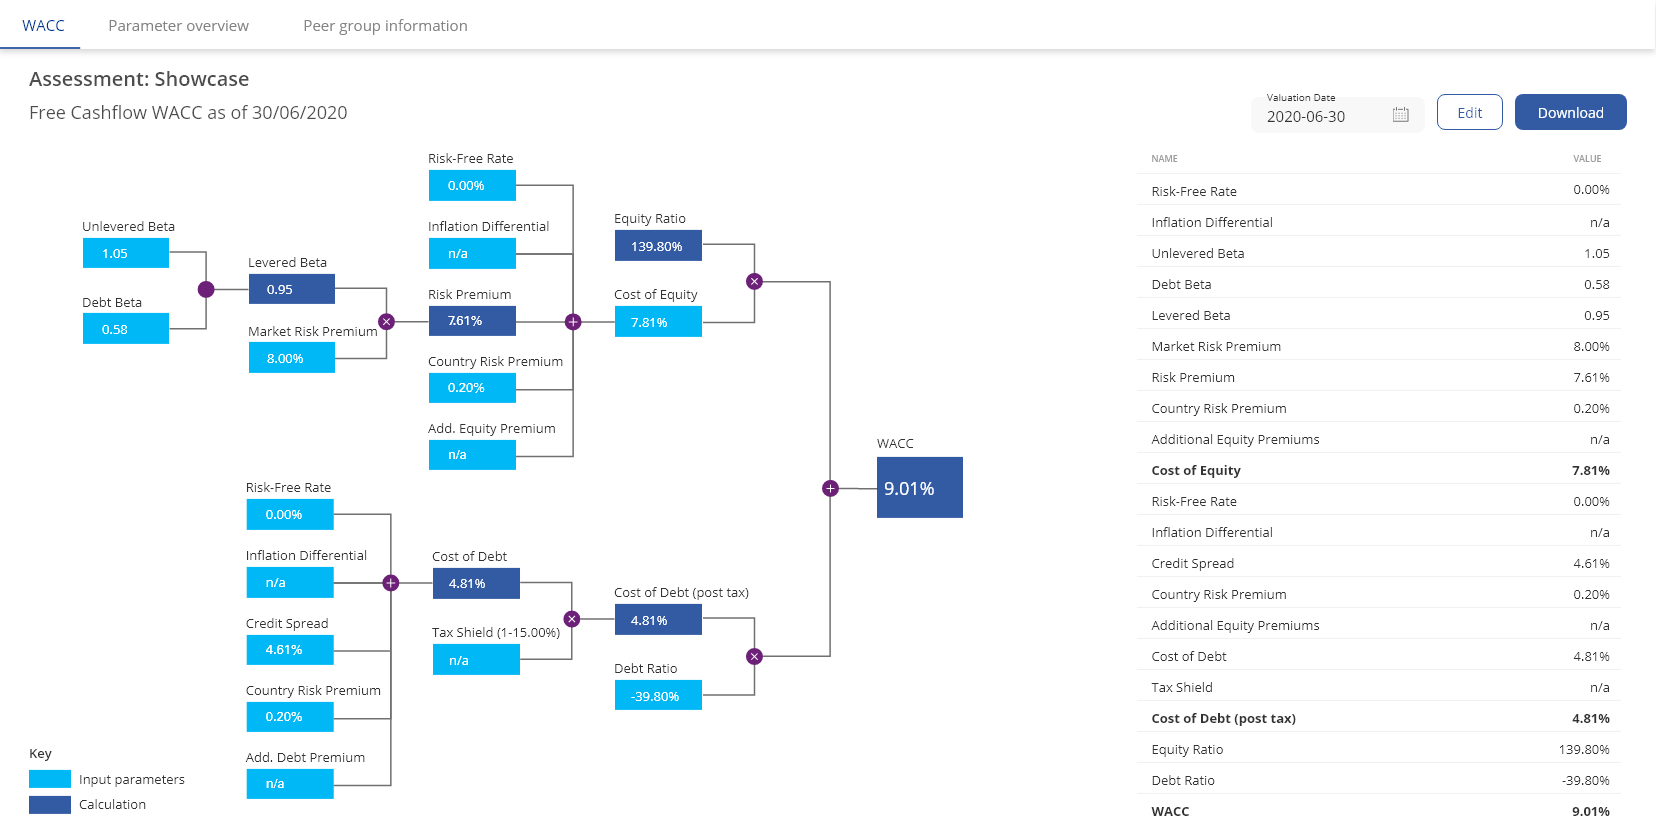
Individual WACC calculation

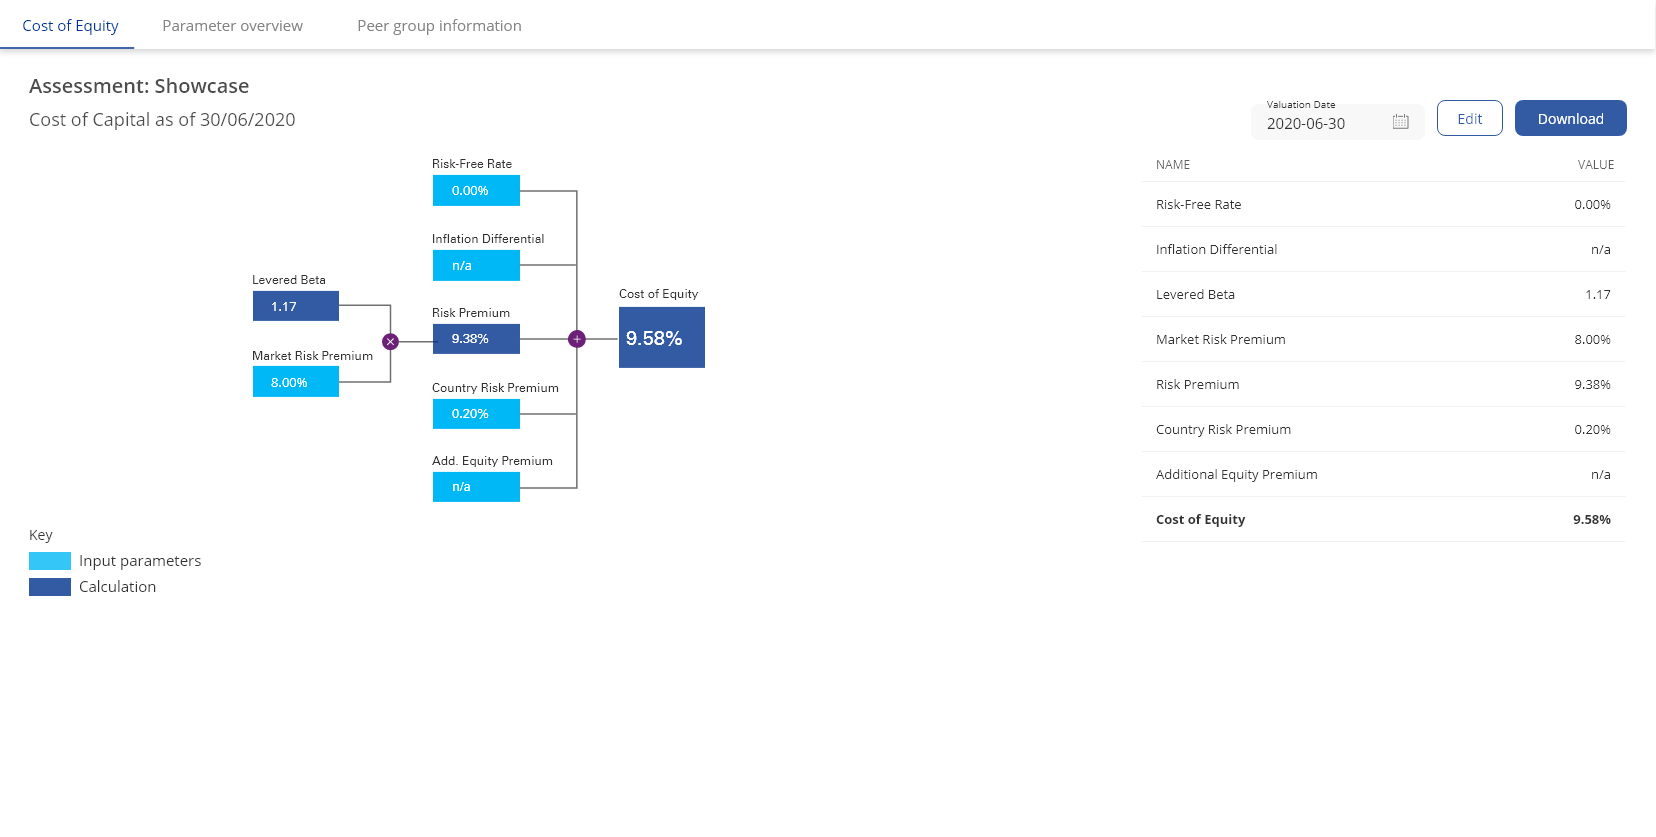
The KPMG Valuation Data Source supports you in deriving your cost of capital in a targeted and efficient manner. Users can derive the company's weighted average cost of capital (WACC) or separately calculate the cost of equity and cost of debt. The monthly updated database contains over 17,500 peer companies from over 150 countries, to create any desired peer group as the basis for the calculation.

In addition, the tool offers users full flexibility. In the parameter settings users can choose whether to use KPMG's expert parameters or use their own values for each parameter during the calculation process.


PRODUCT PRESENTATION


Insights into the cost of capital comparison tool

KPMG Valuation Data Source – test demo for free now

Cost of capital parameters

The KPMG Valuation Data Source provides a comprehensive overview of the cost of equity and cost of debt for over 150 countries based on risk-free interest rates.

The risk-free rate represents the return on a practically risk-free capital investment. It serves as the starting point for determining the cost of equity and cost of debt. In practice, the interest rate on government bonds serves as a benchmark for this risk-free return expectation.

The KPMG Valuation Data Source provides a monthly updated overview of the base interest rate for over 150 countries. We calculate these risk-free rates using regression parameters from central banks' published results, such as the Deutsche Bundesbank, Bank of England, and Federal Reserve.

Using inflation forecasts from the Economist Intelligence Unit (EIU) and the International Monetary Fund (IMF), we calculate the inflation differences between each country and either Germany or the United States, depending on the chosen approach. We provide both short-term and medium-term estimates (up to 5 years) as well as long-term estimates (up to 28 years).
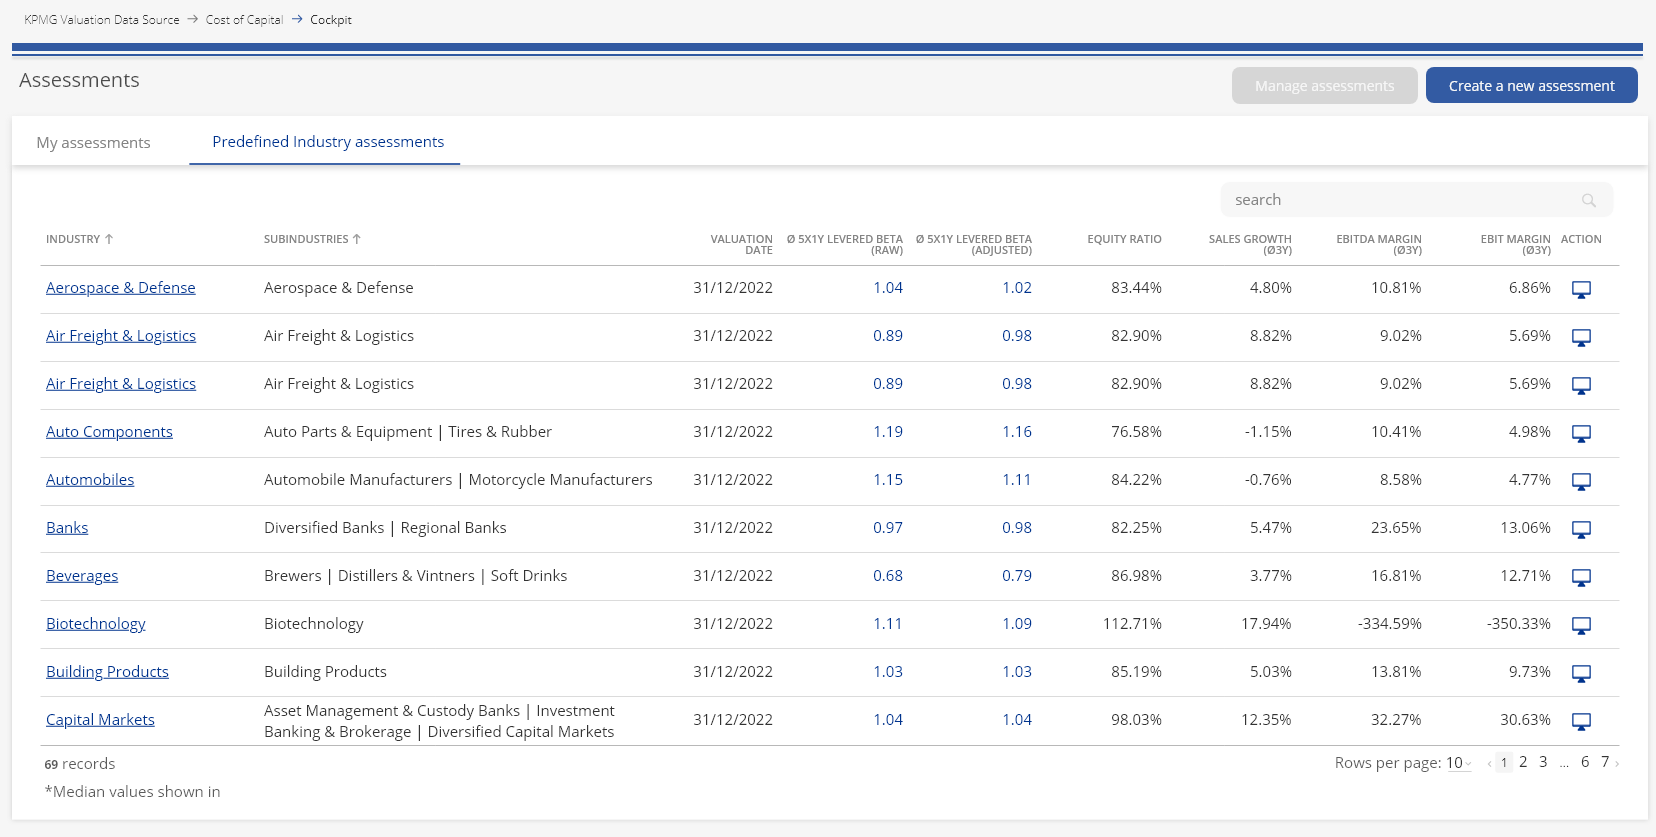
With industry betas for 74 industries and (sub)sectors or an individual derivation, the tool offers a precise determination of the beta factor for your company.

The beta factor reflects the company-specific risk in relation to the market risk and serves as a relevant benchmark for determining the risk premium of the cost of equity.

For listed companies, beta factors can be determined based on historical data from paid data service providers such as Bloomberg or Capital IQ. For unlisted companies, beta factors are determined by compiling a peer group of comparable companies based on comparison criteria such as industry, company size or market share.

The KPMG Valuation Data Source provides industry betas for over 70 industries and sub-sectors. Additionally, the company-specific beta factor is determined based on the users tailored peer group. Users can choose from various assessment periods, including a five-year, two-year, and one-year beta factor.
The Tool offers a precise determination of the credit spread based on current risk premiums of over 17,500 peer companies for an accurate cost of debt derivation.

The credit spread, or risk premium, is a variable cost of debt item that compensates lenders for the assumption of operational risk beyond the risk-free interest rate. It's calculated by subtracting the average risk-free interest rate, specific to the bond's term, from the adjusted average bond yields over a three-month period.

The KPMG Valuation Data Source provides precise calculations of credit spreads using current risk premiums from over 17,500 potential peer companies. We estimate both EUR- and USD-based credit spreads, considering bonds of non-financial and financial companies with various maturities and ratings. Each company’s maturity-dependent credit spread is determined based on its rating on a specific reporting date.
Get unlimited access to market risk premiums for the US, UK, Germany, and Switzerland in the KPMG Valuation Data Source.

The market risk premium is an important component in calculating a company's cost of equity, reflecting the difference between the expected return of holding a risky market portfolio and the risk-free rate.

The KPMG Valuation Data Source provides comprehensive access to market risk premiums from over 150 countries. We conduct our own analyses to estimate these market risk premia. Analogous to the risk-free interest rates, we derive individual market risk premiums for Germany, the United Kingdom, the United States and Switzerland. For the other countries, we use the German or US market risk as the starting point, depending on the chosen build-up approach.

We pursue a pluralistic approach by analyzing both long-term historical capital market data and future yield estimates and risk premiums. In addition, we regularly compare the (real) returns of developed capital markets such as the US, Germany, the eurozone, Switzerland and the UK. By combining both approaches and carefully considering the available information and methodological limitations, we minimize estimation.
Access a precise overview of current country risk premiums and country ratings for more than 150 countries worldwide by the KPMG Valuation Data Source.

Accurately estimating the country risk premium is crucial for determining the cost of capital for companies with international investments. This premium reflects the risk associated with investing in another country, encompassing political, economic, and financial risks. The country risk premium is derived from observable yield differences between EUR and USD government bonds and German or US benchmark bonds with the same maturity, considered to be country risk-free.

The KPMG Valuation Data Source provides access to country risk premiums for over 150 countries. We estimate the country risk premium based on our own analyses and calculations. It is based on the average yield differential between the respective local government bond denominated in Euro or US Dollars and a Euro- or US Dollar-denominated benchmark bond with a similar maturity. German government bonds in euros and US government bonds in US Dollars represent an appropriate benchmark due to their market maturity, liquidity, and absence of default risks.

For countries that do not issue euro- or US Dollar-denominated government bonds, it is not possible to derive a country risk premium directly. In such cases, the country risk premium is derived from observed country risk premiums of countries that are comparable in terms of their creditworthiness, known as 'statistical country risk premium'.
abstract buildings

Risk-free rate

The KPMG Valuation Data Source provides a comprehensive overview of the cost of equity and cost of debt for over 150 countries based on risk-free interest rates.

LEARN MORE
abstract buildings

Country risk premium

Access a precise overview of current country risk premiums and country ratings for more than 150 countries worldwide by the KPMG Valuation Data Source.

LEARN MORE
abstract buildings

Industry betas

With industry betas for 74 industries and (sub)sectors or an individual derivation, the tool offers a precise determination of the beta factor for your company.

LEARN MORE
abstract buildings

Market risk premium

In the KPMG Valuation Data Source you can get unlimited access to market risk premiums for the United States, United Kingdom, Germany, and Switzerland.

LEARN MORE
abstract buildings

Credit spreads

The tool offers a precise determination of the credit spread based on current risk premiums of over 17,500 peer companies for an accurate cost of debt derivation.

LEARN MORE

All the benefits at a glance

WACC at the click of a button

Direct WACC calculation and access to all relevant cost of capital parameters

Assured data quality and timeliness

Reliability and monthly updates of data ensured by KPMG experts

Currency selection

Option of selecting the cash flow currency

Individual peer group

Summary and storage option of own peer group from more than 16,500 companies worldwide

Excel download

Parameters available as Excel spreadsheet for download

Frequently Asked Questions

How is the WACC calculated?

When calculating the Weighted Average Cost of Capital (WACC), the cost of equity and the cost of debt are weighted in relation to the company's capital structure. The cost of equity is calculated using the Capital Asset Pricing Model (CAPM), which considers the risk-free rate, the company's beta factor and the market risk premium.

The cost of debt is assumed to be tax-deductible and thus reduces the tax burden. They are therefore reduced by the income tax burden (tax shield).

The free cash flow WACC is made up of the weighted expected return of all investors (equity and debt capital providers) and the tax effect of debt financing ("tax shield"), as the free cash flow itself does not consider the tax effect of debt financing.

The total cashflow WACC on the other hand already incorporates the tax effects of debt financing. Therefore, it only considers the weighted expected return of all investors without including the tax shield.

With the KPMG Valuation Data Source, you can compute both, the free cash flow WACC and the total cash flow WACC.

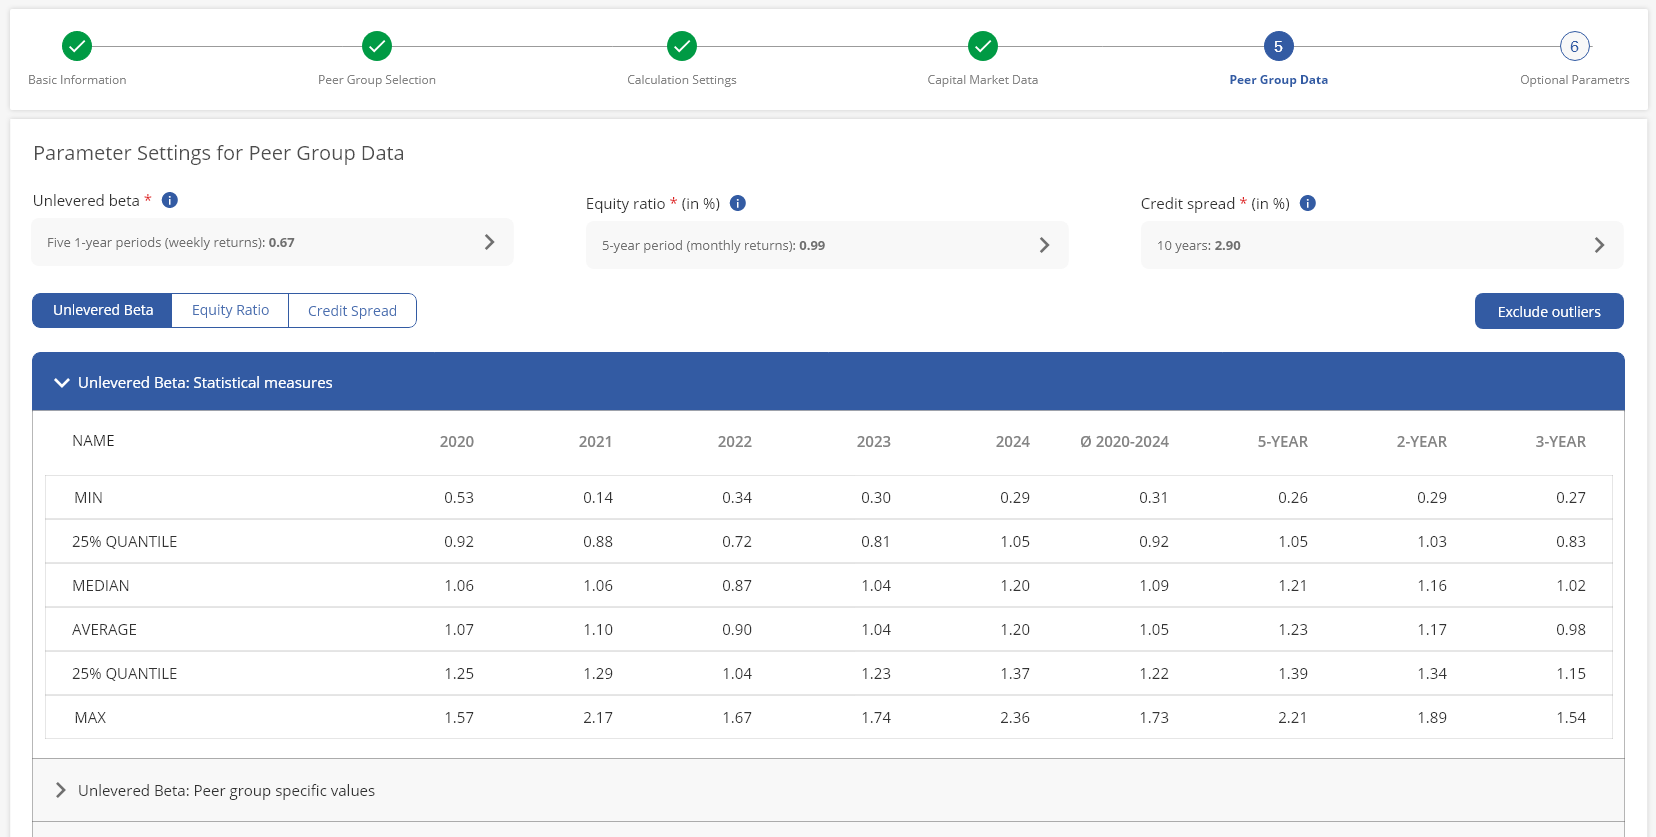
Choosing the appropriate beta factor for calculating the individual cost of capital depends on the specific characteristics of a company. Industry betas offer a simplified way to evaluate company specific risks by using industry risk. A beta higher than 1 indicates that the industry is subject to higher volatility than the market, whereas a beta less than 1 indicates a lower volatility compared to the market. When using the Capital Asset Pricing Model (CAPM) to calculate the cost of equity, one can take the industry beta as a simplified starting point and then adjust it based on company-specifics factors such as gearing and tax rates. The KPMG Valuation Data Source provides various options for determining the unlevered beta factors:

  • Raw vs. Adjusted Beta: The "Raw Beta" is derived directly from historical share price data. For a more accurate representation of long-term company trends, the raw beta can be adjusted to an "adjusted beta".
  • Certain vs. uncertain tax shields: Tax shields represent the tax benefits of debt financing. The degree of risk of a tax shield depends on the knowledge of future debt. To simplify matters, certain tax shields are often assumed. Generally, however, the future level of debt is uncertain and therefore mostly the tax shields are uncertain.
  • Consideration or non-consideration of a debt beta: Incorporating a "debt beta" allows for the inclusion of operational company risk by lenders.
  • Different regression periods: The chosen regression period for estimating the beta can affect the stability and accuracy of the result. A shorter period may increase the volatility of the beta factor, but often also incorporates more recent information. Longer regression periods offer a more stable estimate but take less current information into account.
The selection of the beta factor should be based on a thorough analysis of a company's unique circumstances. The KPMG Valuation Data Source provides a versatile platform with extensive knowledge on various beta types and a wide range of settings to assist in this process.

You can calculate both the cost of equity and the cost of debt in addition to the weighted average cost of capital. The weighted average cost of capital (WACC) is vital for determining the value of a company, particularly for the purposes of impairment testing. However, the process of gathering all relevant parameters often requires time-consuming research and data preparation.

Deriving the cost of capital for your company does not have to be complicated. The KPMG Valuation Data Source streamlines this task by furnishing a comprehensive overview of all essential cost of capital parameters, including betas and credit spreads. Through the streamlined process user can swiftly calculate their WACC, cost of equity, and cost of debt, each of which are also relevant for determining the Incremental Borrowing Rate (IBR).

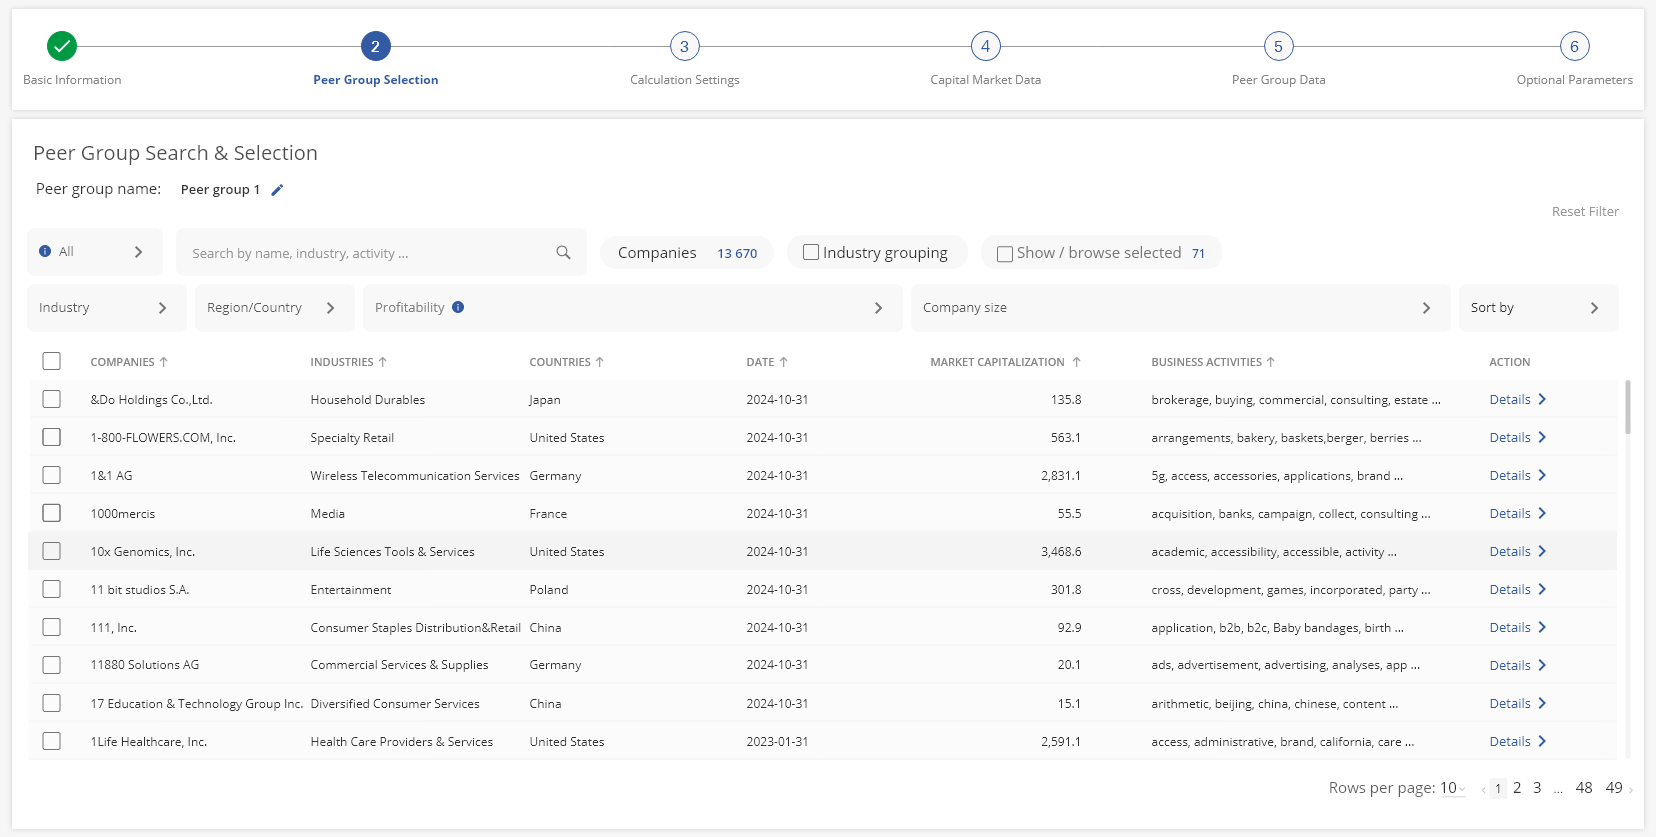
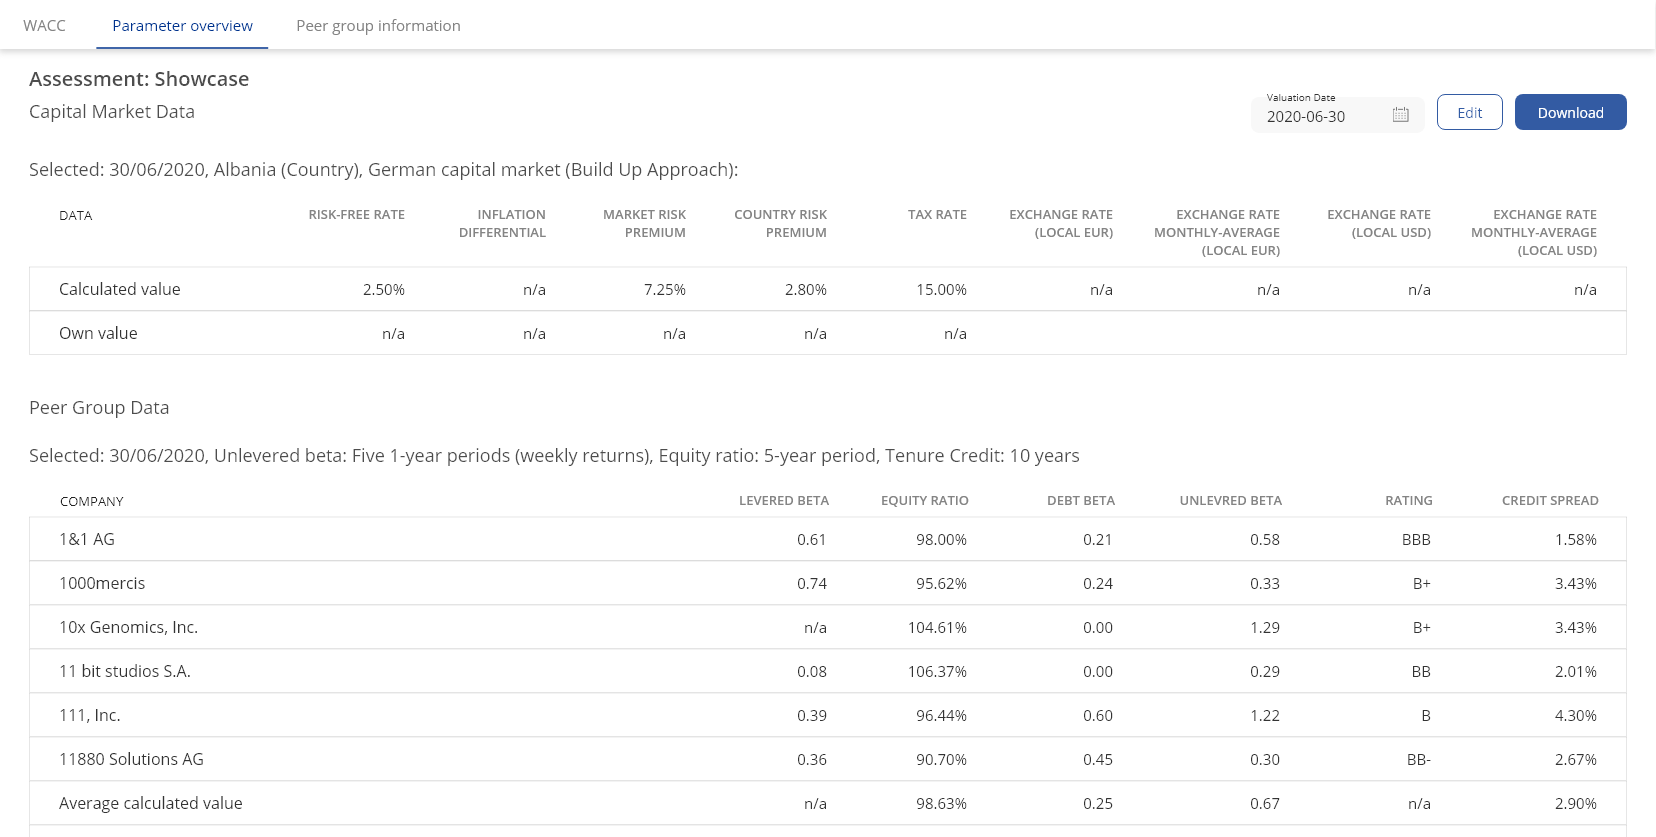
Creating the peer group is a straightforward process within the KPMG Valuation Data Source. To initiate the WACC calculation, users select the preferred reporting date and the desired country, specify the currency, and define the peer group tailored to their requirements. Identifying suitable peer companies is facilitated through the integration of precise search filter functions. Users can employ a variety of filter options based on industry, region or profitability metrics such as margins or growth rates, so the crafted peer group aligns with company specific characteristics and objectives.

For added flexibility, users have the option to incorporate their own values into the cost of capital derivation, overriding the data calculated by KPMG if desired. Our monthly updated database encompasses cost of capital parameters from over 150 countries and 17,500 companies worldwide, with reference dates spanning from 2011 to the present day.

Certainly, it is also feasible to calculate an initial weighted average cost of capital prior to creating an individual peer group. Users have the option to obtain an initial indication of the WACC by accessing monthly updated sector betas and credit spreads from over 70 sectors.

This current sector-specific data provides a valuable starting point, allowing users to gauge the WACC before delving into the peer group creation process. Moreover, the sector data can be easily customized to suit specific settings, supplemented with other desired peer companies, or adjusted for outliers as needed with just a few clicks.

Notably, all entries are automatically saved. This enables users to update WACC calculations for different peer groups to the current reporting date simultaneously with minimal effort, ensuring accuracy and efficiency.

Once calculations and peer groups are created, they can be easily accessed, edited and shared with other users within the platform. This function facilitates collaborative efforts, allowing teams to further refine and work on the results together.

In the final stage, the refined results can be conveniently downloaded as Excel or PDF files, making them suitable for various purposes such as company valuation and the discounted cash flow (DCF) method. If required, the exported results can also be forwarded to auditors along with the documentation for the annual audit process. This flexibility enables users to access their individual cost of capital derivation from anywhere and at any time through the interactive dashboard, empowering efficient decision-making across teams and locations.

Contact us 

Request further information and login details for the free trial version:


Discover more interesting services

Industry-specific cost of capital

Industry-specific cost of capital

Current and reliable cost of capital benchmarks and analysis over time.

Explore
Market risk premium & risk-free rate

Market risk premium & risk-free rate

Overview of the current market risk premium and the current risk-free rate.

Explore
Country risk premium

Country risk premium

Development of selected country risk premia and country ratings.

Explore
Cost of Capital Study at KPMG

Cost of Capital Study at KPMG

The calm before the storm - rising profits and destroyed values?

Explore